written by Yaroslav Yashchenko
According to the International Labor Organization, there were 169 million migrant workers globally as of 2019. Every year many people from all around the world decide to migrate to other countries with a particular goal in their minds – to work there and exploit better economic opportunities that support their and/or their families’ lives.
There are various reasons why people pursue work migration decisions, starting from fewer employment opportunities and low wages in their home countries to cheaper costs of living and better career growth prospects in destination countries. However, what is most important, every work migrant must decide on a particular destination country among other alternatives. Here, the core determinants for work migration decisions are wage gains, distance, and migration policies. While there is plenty of publicly available information for determining the potential wage gains or costs of traveling to a destination country, there is much less information on how migration policies affect the direct and indirect costs of the work migration process. Moreover, there are no comprehensive analytical tools that would allow one to compare the time and monetary costs of the work migration depending on the host and destination countries. Here comes the idea of creating the International Work Migration Index that would benefit various interested stakeholders, including policymakers, research institutions, potential work migrants, or employers.
In late 2022, Liberty International initiated the idea of developing the International Work Migration Index – a pilot study of Ukraine that eventually turned into a pilot study of Ukraine, Poland, and Canada. An international non-governmental organization Atlas Network supported the project initiation, and Liberty International partnered with EasyBusiness – a Ukrainian non-profit think tank, in order to begin the project implementation.
As a result of several months of research, methodology development, work migration steps, and costs validation with experts and actual work migrants, ten cases for three different countries were completed. The final outcome is an easy-to-grasp measurement of time and monetary costs of the work migration process depending on the destination and host countries as well as on the work migrant’s profile. The Index puts a particular emphasis on the costs of bureaucratic procedures, although presenting the total costs for the whole work migration process, including those steps that mostly depend on the labor market and other country-specific conditions.
Before proceeding to the final results, it is worth outlining the general methodology of the Index for a better understanding of all cost components included in the final outcome.
Thus, the methodology consists of four core components: migrant profile, steps and costs of the work migration process, and general assumptions to the latter two components. Here, it is important to outline the cost structure in more detail. Costs of work migration are divided into two distinctive components: time and monetary costs. Both time and monetary costs consist of direct and indirect components. Direct time costs represent actual time spent by a work migrant that includes market search, travel, payment, submission, and general direct time costs, while indirect time costs represent waiting time that the work migrant must bear as a result of either public institutions or private organizations’ actions.
Similarly, direct monetary costs account for direct expenses for the work migrant. However, indirect monetary costs represent the migrant’s lost opportunity – an important parameter that many people ignore, that is simply the amount of money the migrant would have earned pursuing his or her job instead of taking steps of the work migration process.
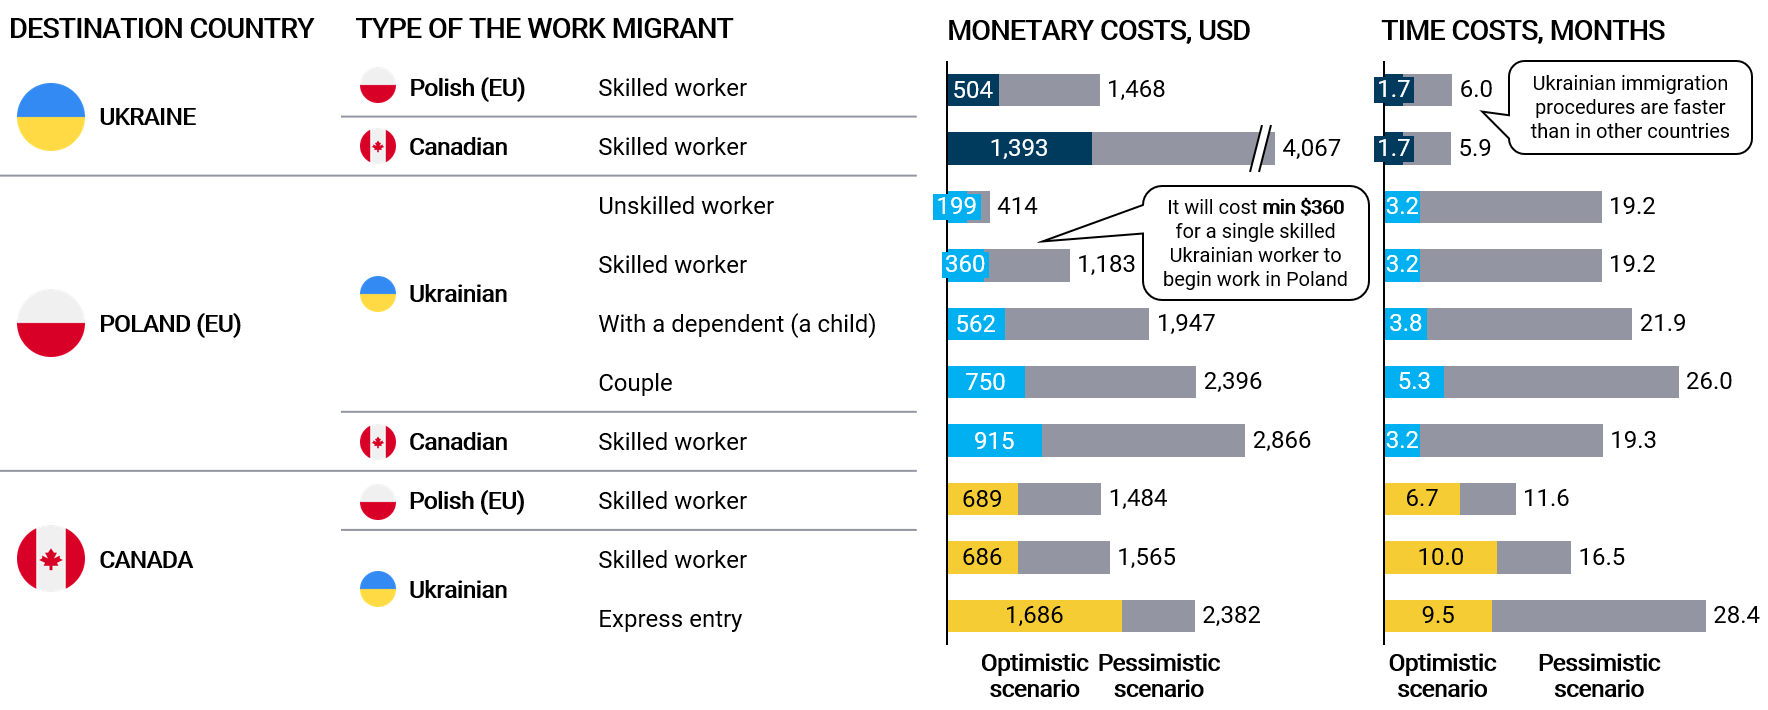
Finally, Figure 2 presents the results of the Index calculations that particularly focus on the time and monetary costs of bureaucracy costs of the work migration process according to ten different cases. It is also important to note that the optimistic scenario is considered as the main base for comparison as given the migrant prepares, submits, etc. everything correctly, he or she could expect to be close optimistic values, while the pessimistic scenario presents the worst-case scenario. For instance, it could take up to one year for Polish officials to issue a temporary residence permit if submitted documents are not entirely correct or missing particular information that is required from work migrants.
The results provide some interesting insights into the differences across examined cases and countries in general. Thus, considering the cases of skilled migrants, bureaucratic procedures account for the large share of the total time costs – up to 60% for Ukraine and Poland (as destination countries), while for Canada cases, the share goes up to almost 90%. Moreover, the indirect time costs or waiting time that work migrant must bear account for more than 94% of the total time costs of bureaucratic procedures. As for the monetary costs, particularly direct, that represent migrant’s direct expenses account for 33-48% for Poland and Ukraine (as destination countries for skilled workers cases), while in Canada such costs take up to 65%.
Total monetary costs for skilled Ukrainian migrating to Poland are generally higher compared to the respective costs of skilled Polish migrating to Ukraine. However, examining the monetary costs breakdown in more detail, the direct monetary costs in both cases are almost the same – the difference arises from the slightly higher Ukraine case direct time costs, on which indirect monetary costs are based.
Canadian migrating to Ukraine or Poland cases yield higher total monetary costs results mainly due to the wage assumptions that are included in indirect monetary costs, which account for a larger share in the total monetary costs structure for the mentioned cases. Thus, direct monetary costs for skilled Canadian migrating to Ukraine amount to around USD 529, while migrating to Poland would yield USD 439 – the difference arises mainly due to the higher direct costs of applying for a visa step for the Ukraine case. Also, while the mutual agreement between Poland and Ukraine results in zero visa fees, Canadians would be required to pay around USD 155 in visa fees as well as slightly more expensive consular fees when migrating to Ukraine.
While it would cost almost the same for either Ukrainian or Polish to migrate to Canada in monetary dimension, Polish migrants would complete bureaucratic steps more than 3 months faster than Ukrainian ones. The reason behind this is the fact the waiting time for obtaining a work permit in Canada for Polish migrant takes 4 weeks on average compared to 20 weeks for Ukrainian. In general, Canadian bureaucratic procedures are lengthier in terms of time costs – obtaining a labor market test only would take from 45 to 80 days.
Overall, Ukraine’s bureaucratic procedures appear to be faster compared to other examined countries. For instance, the official minimum waiting time for residence permit issuance in Ukraine is 2 weeks, while in Poland it takes a minimum of 1 month. The same applies to work permit issuance – it is 4 times faster to obtain a work permit in Ukraine compared to Poland. Relatively lower time costs for Ukraine cases could be partially attributed to the favorable administrative changes during 2015-2019, such as providing an option for employers to obtain work permits for migrants at administrative services centers (that started to practice electronic ques) in addition to employment centers, or allowing applicants to resubmit incorrect or missing documents, instead of having their application rejected.
All in all, the results provide a great analytical tool for the identification of particular bottlenecks in the work migration process that could be examined in more detail, or provide a good starting point for the comparison of how particular migration policies would affect work migration costs – the example of Express entry program for Canada gives a hint that costs could significantly vary from program to program. To explore results and to dive into the detailed steps of the work migration process of provided cases, please visit the respective section of the Liberty International website.
The next steps related to the future of the Index are concerned with promoting Index awareness, upscaling the Index development results even further by including more countries in the scope, and launching a full-scale International Work Migration Index that would be updated on an annual basis benefiting policymakers, research institution, potential work migrants and other interested stakeholders all over the world.


